The increase of London Living Wage to £10.55 per hour and UK Living Wage to £9 per hour has been welcomed by the GMB, but this is still no way near enough to enable a high number of people working in London to actually live in the capital, according to the trade union.
The figure, independently calculated by the Living Wage Foundation, and announced on Monday by the Mayor of London Sadiq Khan, is based on what people need to live in London, and has risen by 35p from £10.20 per hour.
However, while earnings have increased, the rate of growth remains significantly lower than the price of renting property in London.
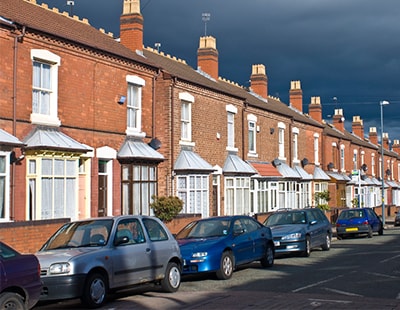
According to the GMB, the average rent for a two-bedroom property in the capital has soared by 21% to £1,450 since 2011.
Warren Kenny, the GMB’s London regional secretary, said: “Last week GMB London showed that rents on two bedroom flats in London have risen by 21.7% since 2011 with the median rent standing at £1,450 a month.”
In 14 of 33 London boroughs, rent on a two-bedroom property jumped by more than 30% over the same period.
Greenwich experienced a 50% increase in rents for the same type of property to an average of £1,350 a month – the biggest rise in London, while local wages have failed to keep pace.
The GMB study found that the average rent for a two-bedroom flat in Kensington and Chelsea is now £2,708 per month, making it the most expensive area in 33 London boroughs for rents for private sector two-bedroom flats. Rents in the area have risen 8.7% since 2011 but have decreased by 10.7% in the past 12 months.
There are two other areas in London where the average monthly rent for a private two-bedroom flat is more than £2,000. These are Westminster at £2,708 and City of London £2,297.
The lowest average monthly rent for a private two-bedroom flat at £1,025 is in Bexley. The increase since 2011 has been 28.9%, but that has not changed over the last 12 months.
Kenny commented: “These high rents are here to stay. So too are younger workers living for longer in private sector rental accommodation.
“As a direct consequence, employers must be prepared to pay much higher wages to staff to enable them to afford these much higher rents.
“If employers don't respond with higher pay they will face staff shortages as workers, especially younger people, are priced out of housing market.”
Kenny blamed policy mistakes for making the housing position for lower paid workers worse.
He added: “Council homes for rents at reasonable levels were aimed at housing the families of workers in the lower pay grades and did it successfully for generations.
“These were sold off, but crucially not replaced as a matter of Tory dogma. Housing benefits was introduced instead to help pay rents for those on lower paid and the costs to the taxpayer has ballooned to over £24bn a year. It would have been far cheaper to build the council homes.
“The chickens are now coming home to roost on these policy mistakes. There is a massive shortage of homes for rent at reasonable rents for workers in the lower pay grades. There is now no alternative to higher pay to pay these higher rents plus a step change upwards in building homes for rent at reasonable rents.”
The figures for all 33 boroughs in London are set out in the table below:
| |
Region
|
2018* Two-bedroom monthly median rent
|
% change in rent 2011**-2018
|
% change in rent 2017***-2018
|
| |
|
|
|
|
| |
ENGLAND
|
650
|
18.2
|
0.0
|
| |
|
|
|
|
|
rank
|
|
|
|
|
| |
LONDON
|
1,450
|
21.7
|
-3.3
|
|
1
|
Kensington and Chelsea
|
2,708
|
8.7
|
-10.7
|
|
2
|
Westminster
|
2,492
|
9.5
|
0.0
|
|
3
|
City of London
|
2,297
|
13.5
|
-3.6
|
|
4
|
Camden
|
1,993
|
15.0
|
-3.2
|
|
5
|
Islington
|
1,907
|
17.4
|
-2.2
|
|
6
|
Hammersmith and Fulham
|
1,712
|
14.5
|
-7.1
|
|
7
|
Tower Hamlets
|
1,700
|
18.9
|
-5.6
|
|
8
|
Hackney
|
1,690
|
25.8
|
-6.0
|
|
9
|
Wandsworth
|
1,650
|
19.0
|
-2.9
|
|
10
|
Lambeth
|
1,582
|
28.1
|
-1.3
|
|
11
|
Southwark
|
1,560
|
20.0
|
-2.5
|
|
12
|
Richmond upon Thames
|
1,540
|
20.8
|
2.7
|
|
13
|
Brent
|
1,500
|
15.4
|
0.0
|
|
14
|
Haringey
|
1,450
|
19.5
|
-3.3
|
|
15
|
Ealing
|
1,447
|
31.5
|
-0.8
|
|
16
|
Merton
|
1,410
|
28.2
|
-2.8
|
|
17
|
Lewisham
|
1,400
|
47.4
|
3.7
|
|
18
|
Newham
|
1,400
|
47.4
|
0.0
|
|
19
|
Barnet
|
1,352
|
20.0
|
-3.4
|
|
20
|
Greenwich
|
1,350
|
50.0
|
0.0
|
|
21
|
Kingston upon Thames
|
1,350
|
26.5
|
0.0
|
|
22
|
Waltham Forest
|
1,300
|
42.9
|
2.0
|
|
23
|
Harrow
|
1,300
|
33.3
|
-1.9
|
|
24
|
Enfield
|
1,300
|
30.0
|
0.0
|
|
25
|
Hounslow
|
1,275
|
27.5
|
-5.6
|
|
26
|
Hillingdon
|
1,250
|
35.1
|
0.0
|
|
27
|
Barking and Dagenham
|
1,200
|
45.5
|
2.1
|
|
28
|
Croydon
|
1,200
|
41.2
|
2.1
|
|
29
|
Bromley
|
1,200
|
33.3
|
-2.0
|
|
30
|
Redbridge
|
1,200
|
33.3
|
-4.0
|
|
31
|
Sutton
|
1,175
|
38.2
|
-1.7
|
|
32
|
Havering
|
1,100
|
33.3
|
4.8
|
|
33
|
Bexley
|
1,025
|
28.9
|
0.0
|
| |
|
|
|
|
| |
|
|
|
|
| |
* monthly rents recorded between 1 April 2017 and 31 March 2018
|
|
| |
** monthly rents recorded over the 12 months to the end of June 2011
|
|
| |
*** monthly rents recorded between 1 April 2016 and 31 March 2017
|
|
Want to comment on this story? If so...if any post is considered to victimise, harass, degrade or intimidate an individual or group of individuals on any basis, then the post may be deleted and the individual immediately banned from posting in future.


.jpeg)


.png)


Join the conversation
Be the first to comment (please use the comment box below)
Please login to comment