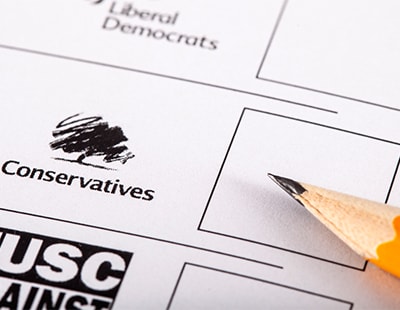
As a general election surely looms, Benham and Reeves has undertaken some research that could potentially help you decide who to vote for.
The independent letting and sales agent in London has looked at which political party has had the most impact on the UK rental market and which way you might want to be voting as a landlord if there is indeed an election in the coming weeks and months.
The company looked at the average rental cost across England between the joint tenure of Labour’s Tony Blair and Gordon Brown between 1997 and 2009 and during the more recent reign of Tory duo, David Cameron and Thersa May.
The Tories have seen the highest average rent during their time in power at £767 per month. This is an increase of £218 or 34.1% on the average monthly rent between 2010 and 2019 - a 3.4% jump each year.
When splitting it between Cameron and May, the former presided over the greatest hike in rents of both Tory leaders.
In Cameron’s six years in charge, the average rent was £717 per month and increased a total of 23.1%, an average of 3.9% per year.
On the other hand, rents under Theresa did average £848 per month but only increased by 2.3% in her four years which is just 0.6% a year on average. Great for tenants for sure. But for landlords? Not so much, in Benham and Reeves’ opinion.
On the face of it, Labour’s time in power was far more tenant-friendly with the average monthly rent hitting just £437 over the 13 years since Tony Blair took over in 1997. However, when looking at the growth of rents during this time the figures tell an entirely different story.
When Labour came into power, the average monthly rent was £334 per month but by the time Gordon Brown left Number 10 this had soared by 86.9% to £624 per month. That’s an increase of £290 per month and an average yearly hike of 6.7%.
While Blair oversaw a rental increase of 39.67% in nine years, this averages out at 4.4% a year, while Brown’s rental increase of 28.8% averages out at a huge 7.2% during his four years.
The resaerch also shows that yields have dropped during the time both parties were in power due to almost continuous property price growth, averaging 4.5% per year under both Labour and the Conservatives.
Blair oversaw the largest average yearly yield at 4.9%.
Marc von Grundherr, director of Benham and Reeves, said: “Probably not the first criteria that you would consider when deciding on your political allegiance but politics and a party’s housing plans can have a big impact on issues of supply and affordability within the rental market, so who you vote for could very well impact upon your personal living arrangements.
“We’re not taking sides either way, but on the face of it, Labour has been the most questionable party in power if you're a tenant struggling with rent affordability, while in terms of investing in the buy-to-let sector, flip a coin as they’re all as mediocre as each other really.”
|
Rents
|
|
Government
|
Period
|
Average Rent During Tenure
|
Total Change (%)
|
Yearly Rental Increase (%)
|
|
Labour
|
1997-2009
|
£437
|
86.9%
|
6.7%
|
|
Conservative
|
2010-2019
|
£767
|
34.1%
|
3.4%
|
|
|
|
|
|
|
|
PM
|
Years as PM
|
Average Rent During Tenure
|
Total Change (%)
|
Yearly Rental Increase (%)
|
|
Gordon Brown
|
4
|
£564
|
28.8%
|
7.2%
|
|
Tony Blair
|
9
|
£381
|
39.7%
|
4.4%
|
|
David Cameron
|
6
|
£717
|
23.1%
|
3.9%
|
|
Theresa May
|
4
|
£843
|
2.3%
|
0.6%
|
|
|
|
|
|
|
|
Yields
|
|
Government
|
Period
|
Average Yield During Tenure
|
Total Change (%)
|
Yearly Yield Change (%)
|
|
Labour
|
1997-2009
|
4.46%
|
-33.6%
|
-2.6%
|
|
Conservative
|
2010-2019
|
4.54%
|
-2.8%
|
-0.3%
|
|
|
|
|
|
|
|
PM
|
Years as PM
|
Average Yield During Tenure
|
Total Change (%)
|
Yearly Yield Change (%)
|
|
Gordon Brown
|
4
|
3.8%
|
1.2%
|
0.3%
|
|
Tony Blair
|
9
|
4.9%
|
-3.4%
|
-0.4%
|
|
David Cameron
|
6
|
4.6%
|
0.2%
|
0.0%
|
|
Theresa May
|
4
|
4.2%
|
0.2%
|
0.1%
|
|
Government
|
Prime Minister
|
Ave Rent (per month)
|
|
Average House Price
|
|
Yield %
|
|
Year
|
England
|
|
Year
|
England
|
|
Year
|
England
|
|
Labour
|
Tony Blair
|
1997
|
£334
|
|
1997
|
£59,160
|
|
1997
|
6.77%
|
|
Labour
|
Tony Blair
|
1998
|
£333
|
|
1998
|
£64,301
|
|
1998
|
6.22%
|
|
Labour
|
Tony Blair
|
1999
|
£326
|
|
1999
|
£70,070
|
|
1999
|
5.59%
|
|
Labour
|
Tony Blair
|
2000
|
£344
|
|
2000
|
£80,814
|
|
2000
|
5.10%
|
|
Labour
|
Tony Blair
|
2001
|
£357
|
|
2001
|
£90,306
|
|
2001
|
4.75%
|
|
Labour
|
Tony Blair
|
2002
|
£417
|
|
2002
|
£107,981
|
|
2002
|
4.63%
|
|
Labour
|
Tony Blair
|
2003
|
£422
|
|
2003
|
£130,218
|
|
2003
|
3.89%
|
|
Labour
|
Tony Blair
|
2004
|
£427
|
|
2004
|
£152,314
|
|
2004
|
3.36%
|
|
Labour
|
Tony Blair
|
2005
|
£466
|
|
2005
|
£163,570
|
|
2005
|
3.42%
|
|
Labour
|
Gordon Brown
|
2006
|
£484
|
|
2006
|
£174,351
|
|
2006
|
3.33%
|
|
Labour
|
Gordon Brown
|
2007
|
£536
|
|
2007
|
£190,025
|
|
2007
|
3.38%
|
|
Labour
|
Gordon Brown
|
2008
|
£612
|
|
2008
|
£182,379
|
|
2008
|
4.03%
|
|
Labour
|
Gordon Brown
|
2009
|
£624
|
|
2009
|
£166,558
|
|
2009
|
4.50%
|
|
Labour Average Rent (per month)
|
£437
|
|
Labour Average HP
|
£125,542
|
|
Labour Average Yield
|
4.54%
|
|
Change growth (1997-2009)
|
86.9%
|
|
Change growth (1997-2009)
|
181.5%
|
|
Change in yield (1997-2009)
|
-33.61%
|
|
|
|
|
|
|
|
|
|
|
|
|
Conservative
|
David Cameron
|
2010
|
£640
|
|
2010
|
£177,472
|
|
2010
|
4.33%
|
|
Conservative
|
David Cameron
|
2011
|
£696
|
|
2011
|
£175,229
|
|
2011
|
4.77%
|
|
Conservative
|
David Cameron
|
2012
|
£705
|
|
2012
|
£177,488
|
|
2012
|
4.77%
|
|
Conservative
|
David Cameron
|
2013
|
£728
|
|
2013
|
£182,581
|
|
2013
|
4.78%
|
|
Conservative
|
David Cameron
|
2014
|
£742
|
|
2014
|
£197,771
|
|
2014
|
4.50%
|
|
Conservative
|
David Cameron
|
2015
|
£788
|
|
2015
|
£211,174
|
|
2015
|
4.48%
|
|
Conservative
|
Theresa May
|
2016
|
£839
|
|
2016
|
£227,337
|
|
2016
|
4.43%
|
|
Conservative
|
Theresa May
|
2017
|
£831
|
|
2017
|
£238,161
|
|
2017
|
4.19%
|
|
Conservative
|
Theresa May
|
2018
|
£844
|
|
2018
|
£245,065
|
|
2018
|
4.13%
|
|
Conservative
|
Boris Johnson
|
2019
|
£858
|
|
2019
|
£244,882
|
|
2019
|
4.20%
|
|
Conservative Average Rent (per month)
|
£767
|
|
Conservative AverageHP
|
£207,716
|
|
Conservative Average Yield
|
4.46%
|
|
Change growth (2011-2019)
|
34.1%
|
|
Change growth (2011-2019)
|
38.0%
|
|
Change in yield (2011-2019)
|
-2.84%
|
Want to comment on this story? Our focus is on providing a platform for you to share your insights and views and we welcome contributions.
If any post is considered to victimise, harass, degrade or intimidate an individual or group of individuals, then the post may be deleted and the individual immediately banned from posting in future.
Please help us by reporting comments you consider to be unduly offensive so we can review and take action if necessary. Thank you.


.jpg)


%20(002).png)


.png)


Join the conversation
Jump to latest comment and add your reply
The research seems only to have addressed rental values, important as this is. But isn't there so much more - e.g. legislation regarding tenancies, housing policy, even whether new tax changes are progressive or regressive - to consider, before votes are cast in a general election? Socially responsible landlords need so much more to go on before entering the voting booth.
Hi David.
Surely, a vote for any party other than Conservative, could mean that we have Corbyn running the country?
This would be disastrous for all of us, have you seen his proposed policies?
I expect that rent caps will follow together with a raft of legislation to curb the greedy landlords.
all are the same
The conservatives have not been our friends, however that's nothing to what Mr Corbyn would do to us.
Exactly.
Please login to comment