Average house prices are now falling 2.9 per cent annually in England and Wales according to the monthly e.surv index.
Yorkshire and Humber and East Midlands maintain price gains and cash buyers remain particularly active in higher-value areas, but the average England & Wales house price is now £366,348 - down 2.9 per cent annually and falling at the fastest rate since 2009.
Richard Sexton, director at e.surv, comments: “Our data, which includes cash purchases, shows that house prices have fallen by some £1,122, or 0.3 per cent, in September, the fourth largest monthly fall of 2023. Prices have now dropped every month since November 2022.
“However, we should see this in the context that prices are still above the level they initially were when the Bank of England started tightening interest rates in December 2021.
“Regionally, Yorkshire and Humber and the East Midlands continue to perform relatively well with house prices maintaining steady growth and outpacing other regions of the UK. The South West saw the biggest fall in annual house prices, of 2.4 per cent more than July of this year.
“The fall in UK house prices is largely down to the higher cost of mortgage finance plus the squeeze on disposable incomes from the higher cost of living. Across the UK’s biggest lenders, the average mortgage rate for a five-year fix with a 75 per cent loan-to-value ratio currently sits at 5.1 per cent, the lowest since July 2023, according to the Bank of England.
“The pause in base rate hikes and increasing competition in the mortgage market may see a return of some buyers who delayed their home moving decisions earlier in the year now returning to the market. However, many other buyers are still waiting for mortgage rates to come down further and for the right property to become available. This suggests that there is a pent-up demand for housing that could be released in the coming months if market conditions continue to improve.”
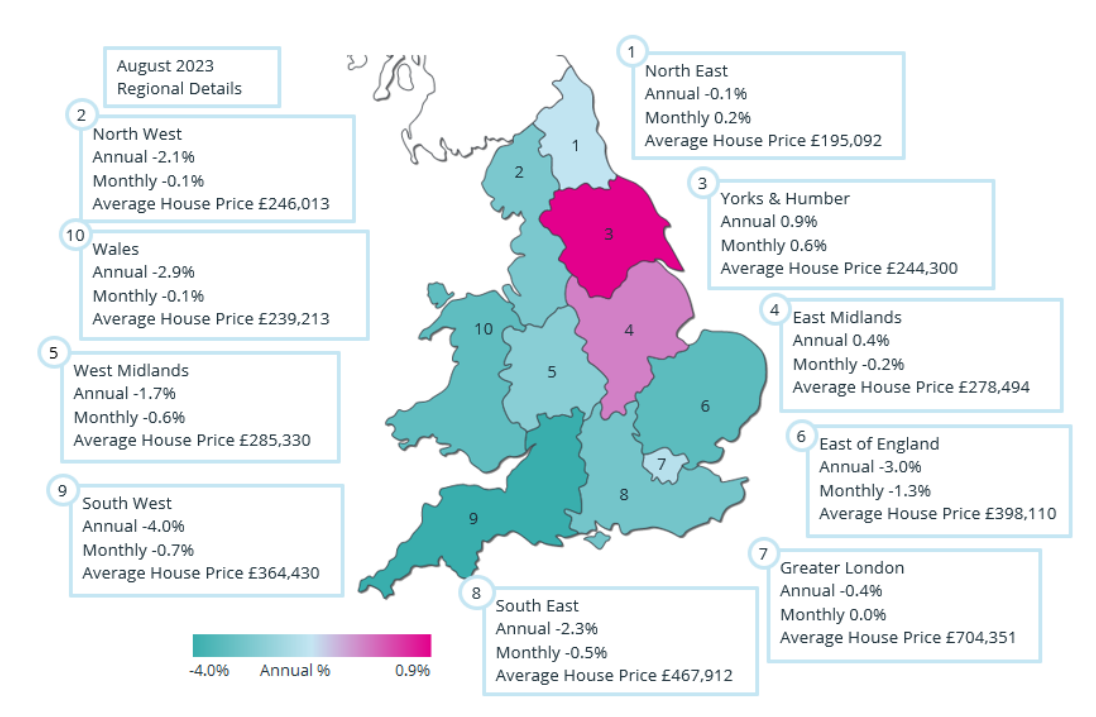
e.surv has produced a regional heat map with three different clusters of regions.
Firstly there are the two reds down the east coast of England - Yorkshire and the Humber and the East Midlands, where prices are still climbing by 0.4 per cent or higher.
Then come the light blue regions of the North East and Greater London – rarely grouped together considering their average house prices are at either end of the property price spectrum - where prices are falling on an annual basis but by 0.4 per cent or less.
Finally, the remaining English regions and Wales are all shaded in green with prices falling by 1.7 per cent or more.
Want to comment on this story? Our focus is on providing a platform for you to share your insights and views and we welcome contributions.
If any post is considered to victimise, harass, degrade or intimidate an individual or group of individuals, then the post may be deleted and the individual immediately banned from posting in future.
Please help us by reporting comments you consider to be unduly offensive so we can review and take action if necessary. Thank you.


.png)


.png)


Join the conversation
Jump to latest comment and add your reply
Is there ever any good news on this site? .. It should be renamed depress the landlord today. 😂
Please login to comment